

Key Points
- The Department of Education’s official FY 2023 cohort default rate is 0.4%, up from 0.0% for FY 2022. Just 14,296 of the 3.37 million borrowers in the cohort defaulted during the three-year measurement window.
- The rate is low because the pandemic payment pause, the on-ramp, and the SAVE forbearance covered nearly all of the window.
- The number that matters is coming next year. Draft FY 2024 rates arrive in early 2027 and will be the first calculated with no pandemic protections in place, and roughly 1,800 colleges already have nonpayment rates of 25% or higher.
The Department of Education released its official FY 2023 student loan cohort default rate on September 30, 2026, and the headline figure is 0.4%. Among 3,372,244 borrowers who entered repayment between October 1, 2022, and September 30, 2023, only 14,296 defaulted by September 30, 2025, according to the Federal Student Aid briefing. That is the fourth straight year the national rate has landed at or near zero, but it bears no resemblance to the 9.3 million borrowers currently in default on federal loans.
The gap between those two numbers is confusing a lot of people, including financial aid offices. The explanation is not that borrowers suddenly started paying. It is that the cohort default rate is a narrow, backward-looking measure, and the pandemic-era protections happened to cover nearly every day of the window it measures.
Basically, if you see this number, disregard it. It’s not helpful… yet. Here’s what to know.
Would you like to save this?
How The Cohort Default Rate Actually Works
A cohort default rate tracks one group of borrowers, those who entered repayment during a single federal fiscal year, and asks what share of them defaulted by the end of the second fiscal year after that. For the FY 2023 cohort, the window opened October 1, 2022, and closed September 30, 2025. Default, for this purpose, means a loan has gone at least 270 days without a payment.
The rate is calculated for every school that participates in federal aid, and the national figure is simply the sum of those schools. The FY 2023 calculation covered 5,417 institutions.
Congress built the measure as an accountability tool: under the Higher Education Act, a school with a CDR of 30% or higher for three consecutive years, or above 40% in a single year, loses access to federal student loans, and for-profit colleges have historically been the schools closest to those lines.
The lag is by design. Because the window runs three fiscal years and the Department needs most of another year to finalize the data, an official CDR describes borrowers who left school roughly four years before the number is published. The FY 2023 rate released this week was calculated on August 1, 2026, about borrowers who started repayment in late 2022 and early 2023.
.tci-chart{
–bg:#ffffff; –ink:#1a1a1a; –ink-2:#555; –ink-3:#8a8a8a;
–grid:#e6e6e6; –line:#1f5fa8; –band:rgba(31,95,168,.08); –band-ink:#1f5fa8;
–tip-bg:#1a1a1a; –tip-ink:#fff;
}
@media (prefers-color-scheme: dark){ .tci-chart{
–bg:#121417; –ink:#f2f2f2; –ink-2:#b8b8b8; –ink-3:#8a8a8a;
–grid:#2a2d31; –line:#6aa7e8; –band:rgba(106,167,232,.12); –band-ink:#6aa7e8;
–tip-bg:#f2f2f2; –tip-ink:#121417;
} }
.tci-chart{max-width:760px;margin:0 auto;padding:16px;}
.tci-chart h3{font-size:18px;line-height:1.3;margin:0 0 4px;font-weight:600;}
.tci-chart p.sub{font-size:14px;color:var(–ink-2);margin:0 0 12px;}
.tci-chart .wrap{position:relative;}
.tci-chart svg{width:100%;height:auto;display:block;overflow:visible;}
.tci-chart .grid line{stroke:var(–grid);stroke-width:1;}
.tci-chart .axis text{fill:var(–ink-3);font-size:12px;font-variant-numeric:tabular-nums;}
.tci-chart .series{fill:none;stroke:var(–line);stroke-width:2;stroke-linejoin:round;stroke-linecap:round;}
.tci-chart .dot{fill:var(–line);stroke:var(–bg);stroke-width:2;}
.tci-chart .hit{fill:transparent;cursor:pointer;}
.tci-chart .lbl{fill:var(–ink);font-size:12px;font-weight:600;}
.tci-chart .band{fill:var(–band);}
.tci-chart .band-lbl{fill:var(–band-ink);font-size:11px;font-weight:600;letter-spacing:.02em;}
.tci-chart .crosshair{stroke:var(–ink-3);stroke-width:1;opacity:0;}
.tci-chart .tip{position:absolute;pointer-events:none;background:var(–tip-bg);color:var(–tip-ink);font-size:12px;line-height:1.35;padding:6px 8px;border-radius:4px;white-space:nowrap;opacity:0;transform:translate(-50%,-100%);transition:opacity .08s;}
.tci-chart .tip b{font-weight:600;}
.tci-chart .foot{font-size:12px;color:var(–ink-3);margin-top:8px;line-height:1.4;}
.tci-chart details{margin-top:8px;font-size:13px;}
.tci-chart summary{cursor:pointer;color:var(–ink-2);}
.tci-chart table{border-collapse:collapse;margin-top:8px;font-variant-numeric:tabular-nums;}
.tci-chart td, .tci-chart th{padding:3px 12px 3px 0;text-align:left;border-bottom:1px solid var(–grid);}
.tci-chart th{color:var(–ink-2);font-weight:600;}
Official National Student Loan Cohort Default Rate, FY 2012–FY 2023
Share of borrowers entering repayment each fiscal year who defaulted within the three-year measurement window
View as table
| Cohort | Official CDR |
|---|
(function(){
const data=[
[“FY 2012”,11.8],[“FY 2013”,11.3],[“FY 2014”,11.5],[“FY 2015”,10.8],
[“FY 2016”,10.1],[“FY 2017”,9.7],[“FY 2018”,7.3],[“FY 2019”,2.3],
[“FY 2020”,0.0],[“FY 2021”,0.0],[“FY 2022”,0.0],[“FY 2023″,0.4]
];
const svg=document.getElementById(‘cdr’), NS=’http://www.w3.org/2000/svg’;
const W=728,H=360,m={t:34,r:24,b:40,l:40};
const iw=W-m.l-m.r, ih=H-m.t-m.b;
const x=i=>m.l+ i*(iw/(data.length-1));
const y=v=>m.t+ih-(v/12)*ih;
const el=(n,a,p)=>{const e=document.createElementNS(NS,n);for(const k in a)e.setAttribute(k,a[k]);(p||svg).appendChild(e);return e;};
// pandemic band: FY2019 to FY2023 cohorts
const step=iw/(data.length-1);
const bx=x(7)-8, bw=x(11)-x(7)+16;
el(‘rect’,{class:’band’,x:bx,y:m.t-8,width:bw,height:ih+8,rx:4});
const bl=el(‘text’,{class:’band-lbl’,x:bx+bw-4,y:m.t-14,’text-anchor’:’end’});
bl.textContent=”FY 2019 TO FY 2023 COHORTS: PAUSE IN WINDOW”;
// grid + y axis
const g=el(‘g’,{class:’grid’}), ax=el(‘g’,{class:’axis’});
[0,3,6,9,12].forEach(v=>{
el(‘line’,{x1:m.l,x2:W-m.r,y1:y(v),y2:y(v)},g);
const t=el(‘text’,{x:m.l-8,y:y(v)+4,’text-anchor’:’end’},ax); t.textContent=v+’%’;
});
data.forEach((d,i)=>{
const t=el(‘text’,{x:x(i),y:H-m.b+20,’text-anchor’:’middle’},ax); t.textContent=d[0].replace(‘FY ‘,”);
});
const fy=el(‘text’,{x:m.l,y:H-m.b+36,’text-anchor’:’start’},ax); fy.textContent=”Fiscal year cohort”;
// line
const path=data.map((d,i)=>(i?’L’:’M’)+x(i)+’,’+y(d[1])).join(‘ ‘);
el(‘path’,{class:’series’,d:path});
// dots + selective labels
data.forEach((d,i)=>{ el(‘circle’,{class:’dot’,cx:x(i),cy:y(d[1]),r:4}); });
const label=(i,txt,dx,dy,anchor)=>{const t=el(‘text’,{class:’lbl’,x:x(i)+dx,y:y(data[i][1])+dy,’text-anchor’:anchor||’middle’});t.textContent=txt;};
label(0,’11.8%’,0,-10);
label(6,’7.3%’,0,-10);
label(7,’2.3%’,-10,4,’end’);
label(11,’0.4%’,0,-10);
// crosshair + tooltip
const ch=el(‘line’,{class:’crosshair’,y1:m.t,y2:m.t+ih});
const tip=document.getElementById(‘tip’), wrap=svg.parentElement;
data.forEach((d,i)=>{
const h=el(‘rect’,{class:’hit’,x:x(i)-step/2,y:m.t,width:step,height:ih});
const show=()=>{
ch.setAttribute(‘x1’,x(i));ch.setAttribute(‘x2′,x(i));ch.style.opacity=1;
tip.innerHTML=’‘+d[0]+’ cohort
Official CDR: ‘+d[1].toFixed(1)+’%’;
const r=wrap.getBoundingClientRect(), s=r.width/W;
tip.style.left=(x(i)*s)+’px’; tip.style.top=(y(d[1])*s-12)+’px’; tip.style.opacity=1;
};
const hide=()=>{ch.style.opacity=0;tip.style.opacity=0;};
h.addEventListener(‘mouseenter’,show);h.addEventListener(‘mousemove’,show);
h.addEventListener(‘mouseleave’,hide);h.addEventListener(‘touchstart’,show,{passive:true});
});
// table
const tb=document.querySelector(‘#tbl tbody’);
data.forEach(d=>{const tr=document.createElement(‘tr’);tr.innerHTML=’
})();
Why Four Years Of Near-Zero Rates Mean Nothing
The Department’s own briefing says the FY 2023 rate “should be interpreted with caution.” The reason is a stack of three overlapping protections. The pandemic payment pause began March 13, 2020, and ran through September 2023, with no Federal student loans entering default during that stretch.
When payments resumed in October 2023, the Department added a 12-month on-ramp through September 30, 2024, during which missed payments were not reported to credit bureaus and borrowers could not be placed in default. Then the courts blocked the SAVE plan, and the roughly 7 million borrowers enrolled in it were placed in a litigation forbearance that stretched from July 2024 into the fall of 2025.
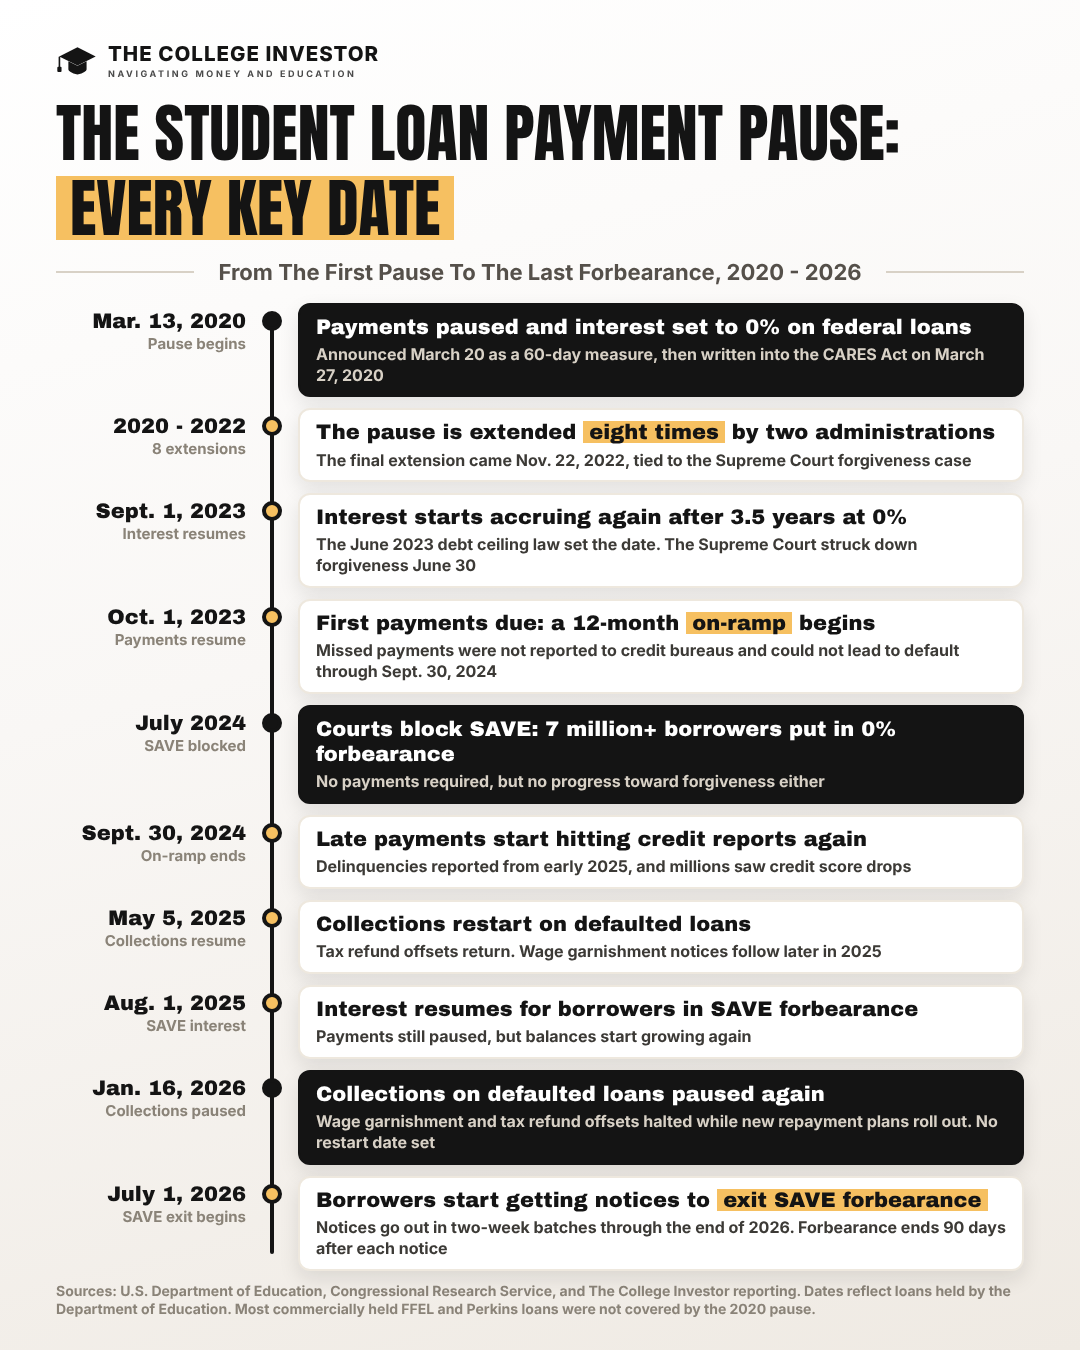
Lay those dates over the FY 2023 window and the math becomes obvious. The National Association of Student Financial Aid Administrators calculates that FY 2023 borrowers had exactly 365 days, October 2024 through September 2025, in which it was even possible to become delinquent long enough to hit the 270-day threshold, and SAVE borrowers were shielded for most of that year. The FY 2022 cohort had zero such days, which is why its rate was 0.0%. For comparison, the last fully pre-pandemic cohort, FY 2018, defaulted at 7.3%, and FY 2016 came in at 10.1%.
The distortion actually starts one year earlier than most people assume. The FY 2019 cohort entered repayment between October 2018 and September 2019, and its monitoring window ran through September 30, 2021. The pause arrived on March 13, 2020, roughly halfway through, and it did two things at once: payments stopped being required, and the delinquency clock froze for anyone already behind. A borrower who was 200 days late in March 2020 stayed at 200 days for the next three and a half years instead of crossing the 270-day line.
That left FY 2019 borrowers with somewhere between five and 17 months of real exposure, depending on when they entered repayment, instead of the usual three years. The result was a 2.3% rate, down from 7.3% the year before. The national rate had been declining slowly since FY 2012, when it peaked at 11.8%, but a five-point drop in a single cohort is not a trend. It is a window that closed early, and every cohort since has had the same problem or worse.
What The Numbers Show Underneath The 0.4%
Even inside a near-zero year, the data is showing a few signals. Borrowers at for-profit schools defaulted at 0.8%, double the 0.3% rate at public and private nonprofit institutions, with 4,821 of 576,634 proprietary-school borrowers in default. Foreign schools posted the lowest rate at 0.2%.
The cohort itself also shrank. The number of borrowers entering repayment fell 4.4% from the FY 2022 cohort, a drop of 156,845 people, and the decline at for-profit schools was 13.4%. The number of participating schools fell by 88, to 5,417, with for-profits accounting for 83 of the lost institutions.
Those shifts track with enrollment and lending trends The College Investor has covered, where fewer students are borrowing even as balances for those who do keep rising.
The Number Schools Should Be Watching Instead
The Department is telling colleges to focus on a different metric: the nonpayment rate. That figure measures the share of a school’s Direct Loan borrowers who entered repayment between January 2020 and May 2025 and are more than 90 days delinquent. The Department refreshed that data on September 22, 2026, using August 2026 figures, and the results show a much bigger issue.
Approximately 1,800 institutions have nonpayment rates at or above 25%, according to the Department’s announcement. That is consistent with the broader delinquency picture: as of June 30, 2026, Federal Student Aid data showed 9.3 million borrowers in default holding $234 billion, with another 1.5 million in late-stage delinquency and roughly 20% of borrowers in active repayment more than 30 days behind.
The nonpayment rate carries no sanctions. The CDR does, and the Department’s announcement spells out what it expects: draft FY 2024 rates will be issued in early 2027, and the official FY 2024 rates next fall will be “the first such release following the full expiration of pandemic-era flexibilities.”
The Department has asked schools above 25% to update their default prevention plans, attend an October 13 webinar, and complete a new self-paced training track on CDRs. The FY 2024 cohort entered repayment between October 2023 and September 2024, and its window closes September 30, 2026, meaning the outcome is already largely baked in.
What This Means For Borrowers And Families
For an individual borrower, the CDR has no direct effect on your loan. It does not change your interest rate, your repayment plan options, or whether your loan is in good standing. Its effect is on the school, and only when it crosses the sanction thresholds.
The indirect effects are the ones worth paying attention to. A school that loses federal loan eligibility loses the revenue most of its students use to pay tuition, and sudden college closures strand students mid-degree.
For borrowers who are behind, it’s a different story. Collections resumed in May 2025, wage garnishment is restarting, and the New York Fed has documented credit score drops averaging 91 points for borrowers who went from current to default.
A borrower already in default can get out through rehabilitation or consolidation, and the Department now runs an online portal for both.
The FY 2023 rate is being measured on misleading data. The FY 2024 and FY 2025 rates will be the first real test of how the post-pandemic repayment system, including the new RAP plan and the end of SAVE, is working.
Editor: Colin Graves
The post The Official Student Loan Cohort Default Rate Is 0.4%. Here’s Why That Number Means Almost Nothing. appeared first on The College Investor.
