
When choosing between exchange operators and data providers, do you prioritize massive profit margins or broad research influence? CME Group (CME +0.78%) and Morningstar (MORN +0.07%) offer two distinct paths for investors.
CME Group provides the plumbing for global derivatives trading, while Morningstar serves as a trusted voice in investment research. Both companies benefit from the long-term growth of the financial markets, yet they operate with very different business models and capital structures. This comparison evaluates their financial health and risks to determine which is better for 2027.
The case for CME
CME Group operates a global marketplace for derivatives, allowing participants to trade futures and options across major asset classes. As a leader among financial stocks, it partners with Alphabet (GOOGL -0.98%) (GOOG -0.96%) for technology infrastructure and Flutter Entertainment (FLUT -1.02%) for prediction market applications. One clearing firm accounted for nearly 12% of clearing and transaction fees in 2025, and customer concentration like this adds a layer of risk to the business.
In the 12 months ended Sept. 30, 2026, revenue reached nearly $7 billion, representing approximately 9% growth over the previous 12-month period. The company reported net income of roughly $4.4 billion, resulting in a robust net margin of nearly 63.1%. This performance follows a consistent upward trend in revenue and earnings, driven by increased trading activity across its diverse global exchange platforms.
As of CME’s December 2025 balance sheet, the debt-to-equity ratio, a metric that compares total debt to shareholder equity to assess financial leverage, is 0.1. The current ratio, which indicates its ability to cover short-term debts with its current assets, reached 1. In the fiscal year ended Dec. 31, 2025, free cash flow was nearly $4.2 billion, representing the cash generated after accounting for capital expenditures to maintain operations.
The case for Morningstar
Morningstar provides essential investment research and financial data to eight primary customer groups, including wealth managers, asset managers, and individual investors. The company operates more than 40 offices globally, offering critical solutions for retirement plan providers, institutional asset owners, and fixed-income security issuers. No single customer accounted for more than 3% of its revenue in 2025, which reflects a highly diversified and resilient client base.
In the 12 months ended Sept. 30, 2026, revenue was nearly $2.6 billion, representing growth of roughly 9.4% over the prior 12-month period. The company generated net income of approximately $445.5 million, supported by rising demand for its data products and research tools. This growth highlights the steady expansion of its footprint in the financial data industry as advisors and investors seek deeper market insights.
As of Morningstar’s December 2025 balance sheet, the debt-to-equity ratio is 1.2. The current ratio is 1. In the fiscal year ended Dec. 31, 2025, free cash flow was close to $442.6 million.
CME & MORN: Performance Comparison
CME – CME Group
$317.97
+0.78% (+$2.47)

MORN – Morningstar
$246.26
+0.07% (+$0.18)
Key Financial Metrics

CME – CME Group
$317.97
+0.78% (+$2.47)
MORN – Morningstar
$246.26
+0.07% (+$0.18)
Market Cap
$114B
52wk Range
$218.31 – $322.82
Gross Margin
82.76%
P/E Ratio
26.07
EPS (TTM)
$12.20
Dividend & Yield
$5.15 (1.61%)
Market Cap
$9.1B
52wk Range
$141.49 – $251.04
Gross Margin
55.23%
P/E Ratio
21.53
EPS (TTM)
$11.44
Dividend & Yield
$2.00 (0.81%)
CME – CME Group
$317.97
+0.78% (+$2.47)
Market Cap
$114B
52wk Range
$218.31 – $322.82
Gross Margin
82.76%
P/E Ratio
26.07
EPS (TTM)
$12.20
Dividend & Yield
$5.15 (1.61%)
MORN – Morningstar
$246.26
+0.07% (+$0.18)
Market Cap
$9.1B
52wk Range
$141.49 – $251.04
Gross Margin
55.23%
P/E Ratio
21.53
EPS (TTM)
$11.44
Dividend & Yield
$2.00 (0.81%)
Risk profile comparison
CME Group faces risks from fluctuating trading volumes, which are sensitive to global economic conditions and market volatility. Intense competition exists from traditional exchanges and alternative trading venues like Intercontinental Exchange (ICE +0.36%) and Cboe Global Markets (CBOE +1.77%). The company must also navigate significant regulatory compliance costs and potential legislative changes that could impact its global exchange operations.
Morningstar is subject to risks from economic downturns, which can negatively affect its asset-based revenue when market values decline. It faces fierce competition from large data providers such as MSCI (MSCI +1.34%) and S&P Global (SPGI +1.08%), as well as the risk of product obsolescence due to new technologies like artificial intelligence. Any errors in its research or ratings could lead to reputational damage or potential legal liability for the firm.
Valuation comparison
Morningstar currently trades at lower multiples relative to its sales and future earnings estimates, making it appear more reasonably priced than the premium-valued CME Group. The forward P/E ratio compares a stock price to future earnings estimates, while the P/S ratio measures the price against sales over the past 12 months.
| Metric | CME Group | Morningstar |
|---|---|---|
| Forward P/E | 25.4 | 18.8 |
| P/S ratio | 16.2 | 3.5 |
Valuation metrics include sourcing from Financial Modeling Prep (FMP) and may differ from other data providers.
Which stock would I buy for 2027?
Both Morningstar and CME Group posted similar revenue growth for the (roughly) trailing-12-month period, so there’s not much to separate them there. However, CME has a robust net margin, clocking in at over 60%. Morningstar isn’t even close; the company’s net margin is about 17%.
Another thing I find appealing about CME is that it pays a modest dividend yielding about 1.6%. Morningstar’s yield is only 0.8%.
That said, let’s turn to the tape:
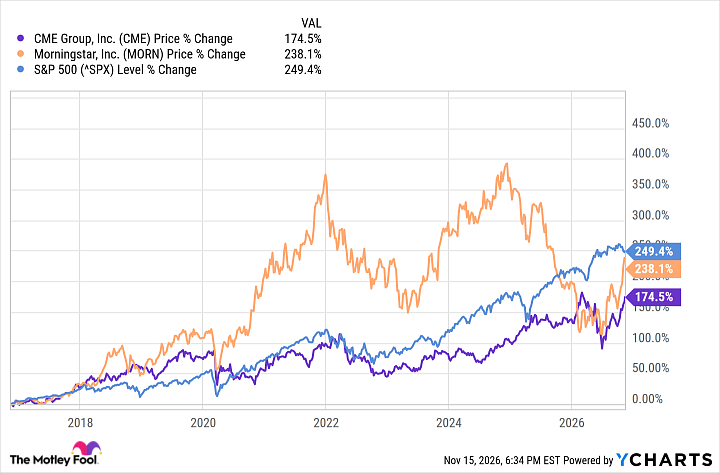
CME data by YCharts
Over the past decade, Morningstar shares have outperformed CME Group by more than 60 percentage points. But neither kept pace with the S&P 500, which is not a good look. Past performance is no indication of future results, of course. But it would be frustrating to be a shareholder of either company during that time frame and not see even average returns.
The final thing I’ll note about Morningstar in the chart above is that the stock experienced considerably more volatility than CME Group. If you’re an investor who’s especially sensitive to that, Morningstar may not be the right choice.
I own shares of CME and don’t intend to sell them anytime soon. CME gets my vote for 2027, but perhaps it’s worth considering a simple ETF that follows the S&P 500.
Where to invest $1,000 right now
When our analyst team has a stock tip, it can pay to listen. After all, Stock Advisor’s total average return is 823%* — a market-crushing outperformance compared to 209% for the S&P 500.
They just revealed what they believe are the 10 best stocks for investors to buy right now, available when you join Stock Advisor.
See the stocks ›
*Stock Advisor returns as of November 16, 2026.

